Reading Between the Lines - Finding the Opportunity in Fear Mongering Articles
- admin0914730
- Jan 30
- 6 min read
By: Mason McDonald
Fear!
If there was ever an industry where the news and articles suggested doom and gloom consistently it would be real estate. No matter where we are in a market, you will hear and read articles about how it’s the worst time to buy, it’s the worst time to sell, it’s the worst time to build, and it’s the worst time to invest in real estate.
At least that’s what the headlines say.
That’s also what my friends will tell me. I have friends that are still waiting on the market to crash so they can buy their first home. Unfortunately for them, they have been waiting on that day for the past 8 years now.
The reason that I chose this topic to write about in this month’s newsletter is because I am seeing, once again, an influx of articles and videos that indicate that the housing market is about to crash. However, I am going to attempt to do a high-level overview and analysis of the data that will show why I think there is substantial opportunity for those of us in the land and development space, despite what the media might be telling us.
What the Headlines Show


Now, if you were to simply read the headlines of these articles and not dive into the indicators that the “experts” are insinuating are leading to the real estate market “crash”, it might feel normal to be panicked. However, since you are reading this article and obviously love real estate data, let’s dive into the data briefly.
The Data and Basic Analysis
In an effort to not get lost in the weeds with too much data, I’ll pick a few key metrics for us to examine.
Existing Home Sales
This shows total existing home sales since May of 2020. The next chart will show that same data from November of 1980 through February of 2024. This is important to note the difference when you extend the length of time in the chart to see that the data does not look as abnormal when you compare “normal time” to “normal time” vs “recession time” vs “pandemic time”. I think when examining any graph, it is always important to look at the margins first to determine if there is any sort of manipulation of scale or timeline that might encourage you to think one way or another.
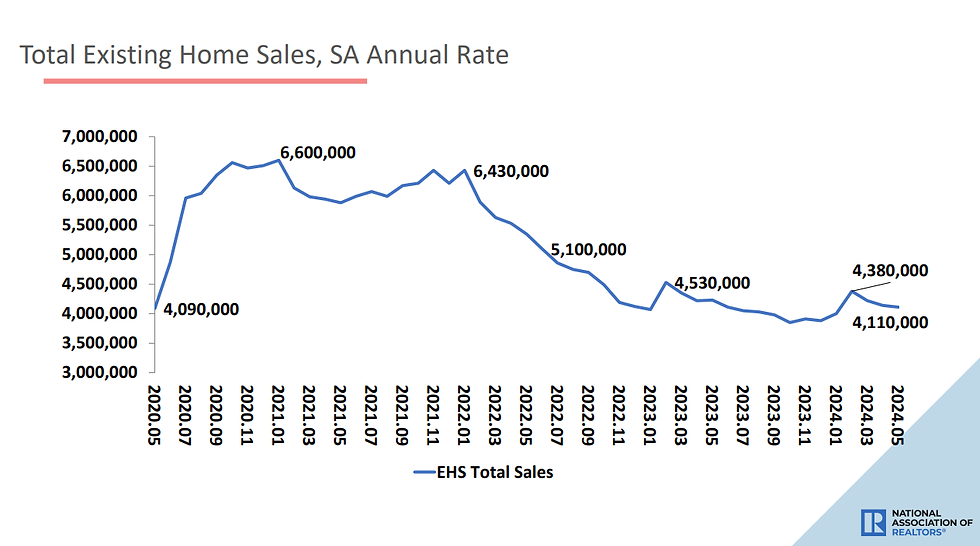
It’s hard to determine exactly what the appropriate amount of monthly home sales “should” be; however, if you look at data over the last 44 years, you can see there is a major world event corresponding with each spike and then it normalizes closer to the ~4,000,000 sales/month range. (I highly recommend you look at the link above for the source of this data as there are multiple great graphs I will not include in this article that I encourage you to check out.)

Supply, Demand, Pricing, and Mortgage Rates
Too often we think of supply and demand only in regards to inventory. If there are more people who want housing than housing available, demand goes up. If there are more people who want a Honus Wagner baseball card than Honus Wagner baseball cards available, demand goes up. Typically, there is an associated increase of price of the desired asset/object/baseball card too.The same factor is true in regards to the supply of money. If there is an oversupply of cheap capital available, the desire to purchase increases.
This is (and I realize I am grossly oversimplifying this point) exactly what happened during the COVID-19 Pandemic. Money was cheap, 30-year mortgages were below 3%, and demand shot the roof. Mortgages being at such low rates and there being a constraint on inventory since demand increased so rapidly, caused an extreme surge in home prices in the USA. However, despite mortgage rates increasing over the last year, pricing has remained constant, demand has slightly decreased, and supply has slightly decreased too. This shows that despite concerns of supply beginning to increase more rapidly, there is still a significant amount of correction that needs to occur in the market before there is any cause to worry about putting too much housing inventory on the market.

This graph outlines the sharp dip in sales at the start of the pandemic and then the rapid rise in sales with the corresponding rate drops. Then once again, the dip in sales after mortgage rates substantially increased. However, based on total volume of sales and comparing it to the four preceding years, the numbers begin to look a lot more similar. That’s why it’s so crucial to extend the length of time that you are looking at data to more accurately see what trends are occurring.
As humans who behave irrationally, it’s hard to sometimes see that there is a correlation or no correlation between the data we’re observing and the events happening around us. It’s an election year this year and that will cause a change in behavior for buyers and sellers alike; however, if you look back at all the recent election years and see what happened, there is not a staggering change in behavior. Something that might seem surprising but when you have the data to validate or invalidate your hypothesis, the point becomes moot and then you have to examine the larger macroeconomic indicators and realize it’s really really hard to predict anything. The next two graphs show supply vs sales and sales price.


Despite rising mortgage rates, we have seen a continual increase in median sales price since 2020. With lowering rates of supply and less desire to move due to the historically low rates that many buyers locked in during 2020/2021, the price of homes was able to increase despite the higher rates.
Speculation and Opportunity
The great thing about operating in an environment that has so many factors influencing it that you can begin to see what happens when one lever is pulled. Supply vs pricing vs mortgage rates vs aging population, etc.. And with that, the longer you wait and the more you extend the data you examine, the greater ability you have to see that with any large scale influence that occurs on the real estate market, there tends to be a correction that will occur. However, I want to spend time focusing on where I believe the opportunity lies whenever there is seemingly more fear than usual.
Finding Certainty in an Uncertain World
I recognize how simplistic my approach was in regards to which variables affect the real estate market. I also want to over-emphasize the point that no one can predict what the market will do. I also want to double over-emphasize that humans are irrational and will not necessarily do what we expect them to do. However, the most certain thing that we can glean from all this data and human behavior is that, at least for now, people in America are still buying homes and there is a need for inventory to be created through building new homes. Additionally, with 2024 being an election year, we can expect some potentially erratic behavior that will be created through even more fear mongering articles about the election and real estate market. This is where we have the opportunity to capitalize on a greater focus on the acquisition, and creation, of build-ready land.
Where to Buy
The way that we typically analyze a market on where to buy land starts with current and historic migration trends. Over the past several decades, there has been a consistent trend of movement from several states in the northeast and west coast into the south, southeast, and sunbelt. While there is still an extreme amount of desire to live in the states where there is movement (California, New York, Washington, etc.), with cost of living increasing, typically higher taxes, and typically greater regulations for businesses, we can anecdotally reason why people are fleeing these states and moving somewhere warmer, cheaper, and with less regulations. See the map below that outlines the states with the greatest inbound and outbound moves in 2023. Additionally, click on the link here to dive even further into the data. The amount of data available that shows which states people are moving to and from is a fantastic market indicator but also the data that shows the states where people are constantly moving WITHIN the state show opportunity for an acquisition focus as well. The main point here is to follow the trends and continue to operate as usual.

Conclusion
While there is a lot more data that I wanted to bring into this article (namely NAHB Builder Confidence), I felt that we have arrived at a decent stopping point for this month’s newsletter. If you read this article and feel like there was not a great takeaway, that’s good. That was the point. The idea that any of us are capable of effectively predicting the market and deciding the best course of action, even with access to tremendous amounts of data, is unfortunately impossible. The goal in business is to have an efficient and profitable model that works well despite changes and fluctuations in the market. I.e. a business that purchases assets at a discount that are always going to be desirable.


Comments